Installations-Instruktionen in Deutsch
Scientific Plots
Collection of programs for visualization of data
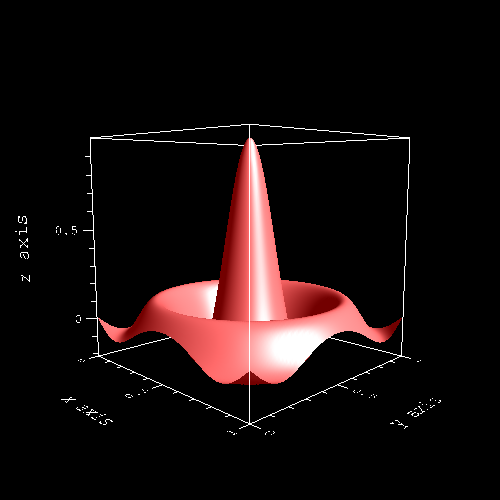
surfplt
I have written a collection of three programs for visualizing data and thus also functions, using the "OpenGL" graphics library.
The program surfplt(1) visualizes a two-dimensional array of real numbers as a curved surface, with the numbers defining the height of the surface points.
The program xyzplt(1) draws points or lines within a three-dimensional cube.
The program xyplt(1) also draws points or lines in the xy-plane.
The programs are not called as a subprogram using a library for user use, but are executed as standalone programs. Data is passed via ASCII files in a specific format.
If, for example, the results of a calculation should be visualized, then the calculation program saves the results in the data format of the plotting program. Only after this is the plotting program called.
The data formats in which the ASCII files are passed to the plotting programs are described in the English manual pages.
All three programs are controlled exclusively via the command line and have no graphical user interface.
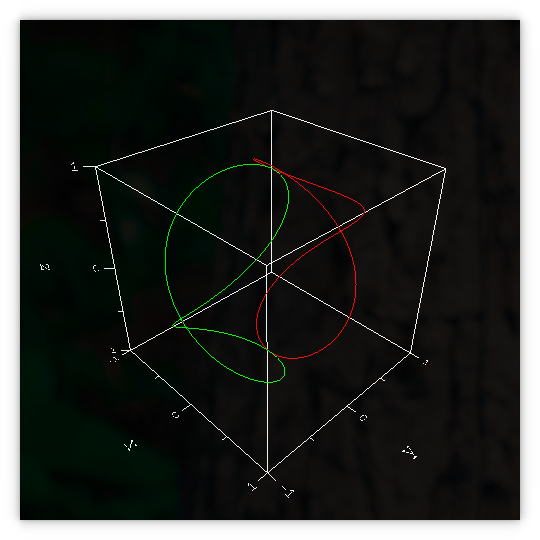
xyzplt
Used programming languages and libraries
The programs are written in the programming languages C and C++ and are compiled using the GNU C and C++ compilers. They require the OpenGL library version 2.1, along with the GLU and GLUT libraries.
Furthermore, for text rendering, the "freetype" and "ftgl" libraries are required.
The GNU Fortran compiler is also needed to generate the test files.
The libraries can be installed with the standard package manager on most Linux distributions. I developed the program collection under Ubuntu 20.04; however, the programs should also run on all other current distributions.
Download and Installation under Ubuntu 22.04 to 26.04
To compile the program, you need the GNU C, C++, and Fortran compilers and GNU make, which can be installed with the following command:
sudo apt install gcc g++ gfortran make git
Furthermore, you need the above-mentioned libraries, which can be installed with the following command:
sudo apt install libglu1-mesa libglu1-mesa-dev freeglut3 freeglut3-dev libfreetype6 libfreetype6-dev libftgl2 libftgl-dev
Libraries for Ubuntu 24.04 to 26.04
The libraries for Ubuntu 24.04 to 26.04 are installed with the following command:
sudo apt install libglu1-mesa libglu1-mesa-dev libglut3.12 libglut-dev libfreetype6 libfreetype-dev libftgl2 libftgl-dev
Download of the Sourcecodes with git
The directory of the program collection can be downloaded from github.com using the following git command:
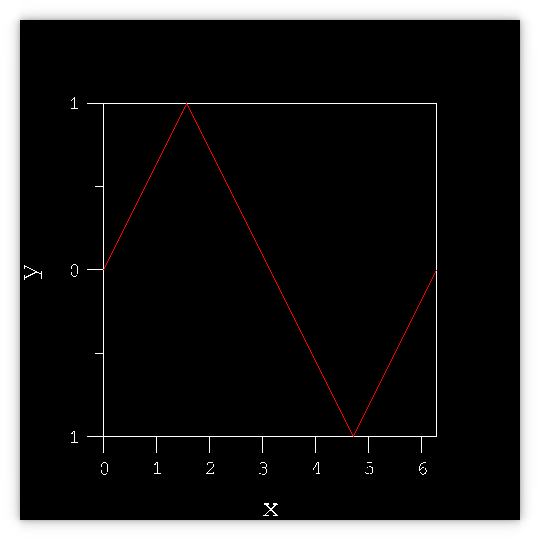
xyplt
git clone -b master https://github.com/RalphTrenkler69/scientific-plots
After this, the directory "scientific-plots" contains the source code.
The following commands can be used to compile the programs and install them in /usr/local/bin after downloading:
cd scientific-plots

    make

    sudo make install
How to choose the right fonts
The font used (Font) can be adjusted in the Makefile by setting the variable FONT.
The file path for the .ttf file of the Font must be specified there.
After the installation
You can test the programs after installation using the following commands:
    surfplt surftst5.dat

    xyzplt xyztst4.dat

    xyplt xytst1.dat
You can call the manual pages for these programs using the following commands:
man surfplt

    man xyzplt

    man xyplt
Online manual pages for the programs
Here are the manual pages for the programs in English.